The Onsager viewer

A pathway-level method for charting recovery and unintended worsening in RNA-seq experiments
Mobile view does not support running a fresh Onsager analysis. Please use the desktop version if you want to run a fresh Onsager analysis from DESeq2 results files.
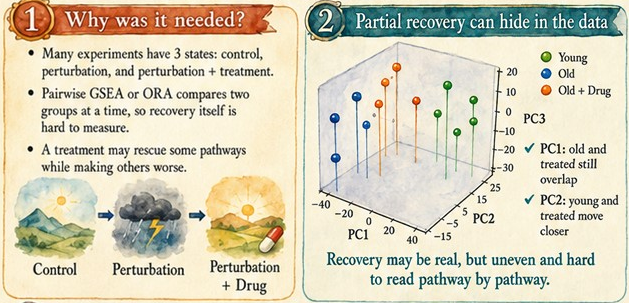
What is the model behind? The Onsager prominence model separates RNA-seq recovery analysis (both bulk or single cell) into gene-level perturbation, pathway impact, treatment recovery, and final recovery prominence. It compares Control, Condition, and Condition + Treatment states using tables from DESeq2 differential expression results, giving as output category-level metrics, showing the impact of the Condition in the category, as well as the recovery. The model also indicates which categories worsen with the treatment.
What is the graph showing? The graph shows one dot per category, with size depending on the number of genes. On the x axis ΛC, the original pathway-level impact of the Condition relative to Control, and on the y axis ρC, the recovery of the treated state relative to the Condition state. When ρC > 0 it means the Treatment moves the expression of the genes in the category closer to Control than the original Condition state. ρC < 0 means worsening respect to the control phenotype, and this can come from same-direction worsening, overcorrection beyond Control, or a new off-axis perturbation introduced by Treatment. The Onsager prominence index, ΩC, is a value between -1 and 1, it is represented by colour, and higher values mean more prominent recovery, while more negative values mean more prominent worsening, and values closer to zero mean a combination between recovery in a non-affected category or non-recovery in a highly affected category.
How does the viewer work? The viewer loads the category_scores.tsv table produced by the Onsager software in Python (not yet available here) and draws the Onsager map. It lets you inspect dots, filter category names, and constrain visible points by gene count. Files remain local in the browser during each use; nothing is kept on any server.
Warning regarding statistical significance: Onsager can optionally calculate permutation-based p-values for ΩC. These assess how unusual the result is under the randomisation model and do not provide independent biological validation. This option is available only in the command-line version, although the resulting tables can be loaded and filtered in the web viewer (the demo files already include this). Please contact me if you would like to try it before its public release.
Why Onsager? Lars Onsager was a Norwegian-born scientist awarded the Nobel Prize in Chemistry in 1968 for reciprocal relations that are fundamental to the thermodynamics of irreversible processes. Our model is not directly derived from Onsager’s theories, nor does it claim that gene expression follows these thermodynamic laws. However, the model is inspired by Onsager’s broader statistical-mechanical legacy, including the use of spin-like states and order parameters, ideas strongly associated with his exact solution of the two-dimensional Ising model. Furthermore, our model asks whether a treatment moves a perturbed pathway back toward its control state, leaves it unchanged, or drives it further away, in conceptual dialogue with Onsager’s work on irreversible processes.
Why prominence? We use this in analogy with the concept in topography, where the absolute height of a mountain is distinguished from how much a summit stands out relative to surrounding terrain: it is not the same climbing a very high but low-prominence summit, such as Mount Cameron in Colorado (height 4,340 m, but prominence about 46 m, measured from the saddle connecting it to higher Mount Lincoln), as climbing a lower summit like Mount Teide, which rises about 3,715 m from sea level to the top. Similarly, it is not the same recovering completely a mildly affected pathway (high recovery, but low “prominence”) as recovering one strongly perturbed by the condition.
For a visual summary of the model, we have created an infographic for you.